User Guide
Using SpatialWork on the Web
Build and view 3D digital twins in the browser, drive them from live data, lay out and simulate spaces with an agent, and publish read-only links people can open without an account. No install.
What SpatialWork is
SpatialWork opens the 3D spaces your team builds (models, splats, whole buildings) in the browser and lets you hang live data on them: charts, gauges and status panels that read straight from your databases and APIs, objects that show their readings when clicked or change colour with their data, and copies that move with their data. On top of that, an agent can lay out a room from a sentence, and a simulator runs people through the space to show where it queues and crowds.
| Step | What happens |
|---|---|
| 1. Build the scene | Import models into a new scene here, or publish one from Unity SpatialWork. |
| 2. Open it on the web | Sign in with your Central Platform account; your projects are waiting on the dashboard. |
| 3. Add live data | Connect a source, describe a chart in plain words, place it in the scene. It refreshes on its own. |
| 4. Share it | Publish a read-only link, or embed it in your own dashboard. |
Who sees what
| Person | What they get |
|---|---|
| The owner | Everything: edit, connect data, publish, share, rename, delete. |
| An editor you added | Edits the project like you, except publishing, renaming, deleting and re-sharing (§22). |
| Someone with the published link | Read-only, no account: looks around, switches viewpoints and shown versions, clicks objects. Chart data still updates live; they never see your data connections. |
- What SpatialWork is: how it works, who sees what, your data
- 01–06 Projects, sign-in, moving around, the Scene panel, undo, adding content
- 07–11 Data sources, charts, interactive objects, dynamic objects, heatmaps
- 12–15 Build with Agent: data objects, space layout, the simulator; spatial analytics
- 16–19 Look and settings, viewpoints, versions, restore points
- 20–24 Publishing, group switches, sharing, embedding, troubleshooting
01 What you are working with
A project is a 3D scene plus everything layered on it: imported models, data charts, interactive objects, heatmaps, saved camera viewpoints, and the connections to wherever your data lives. Two kinds sit side by side on the dashboard:
| Kind | What it is |
|---|---|
| SpatialWork scene | A 3D scene you build in the browser, or one published from Unity SpatialWork. Everything in this guide applies to it. |
| GeoSense | A map-based project, opened in the geo editor. Different tool, same dashboard and the same sign-in. |
Work saves as you go, and the top bar shows when it last saved. Save there saves at once. Ctrl+Z takes back an edit you did not mean (§05).
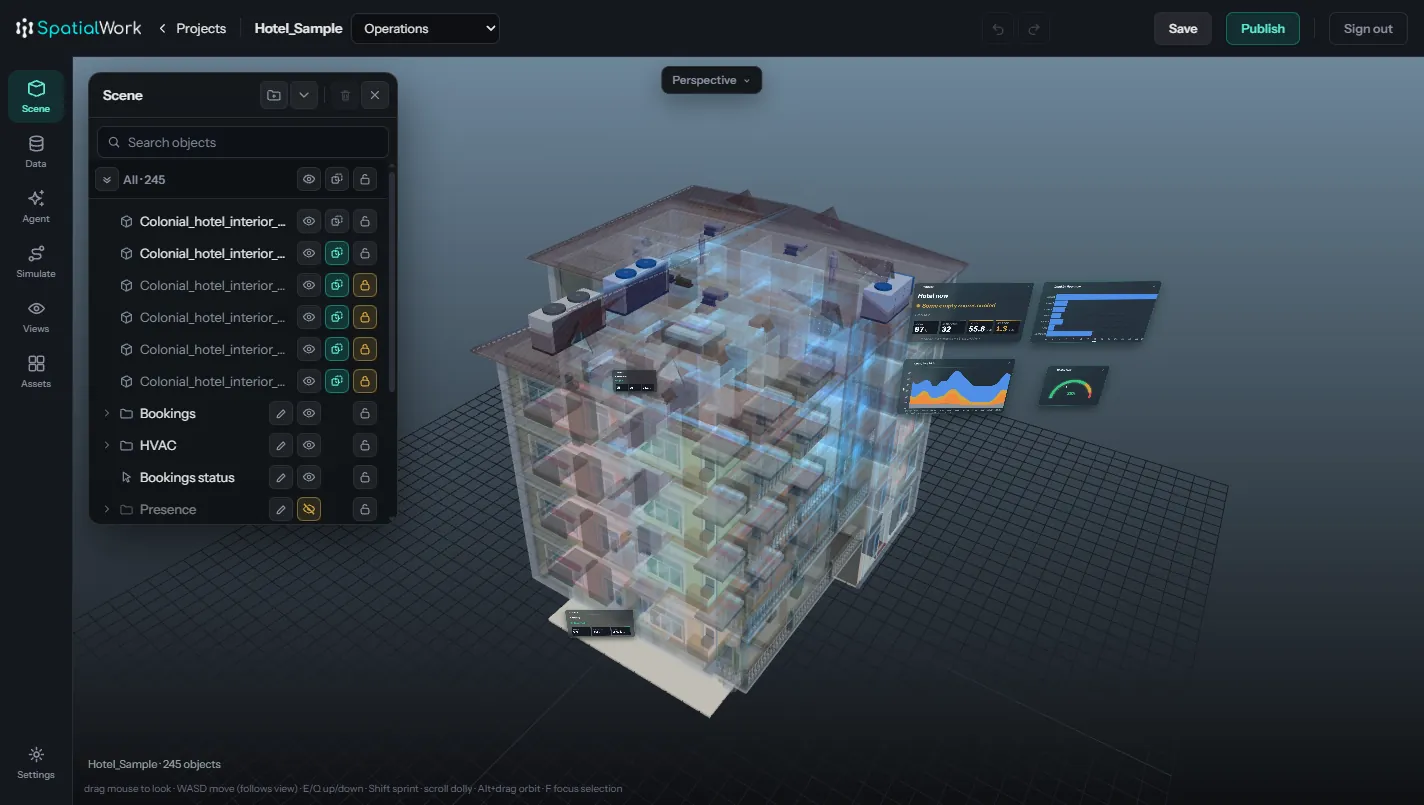
02 Sign in, and your dashboard
Log in with your Central Platform account, the same email and password you use elsewhere in Hiverlab tooling. You land on the dashboard, which lists every project you own or that someone has shared with you.
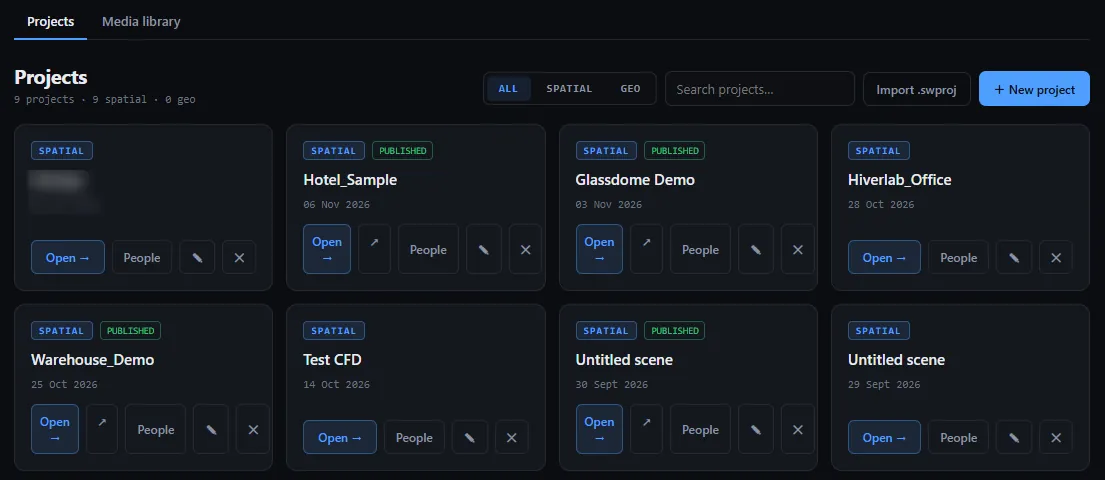
- Open a project by clicking its card.
- Rename, delete and import a .swproj file from the card and header controls. Only the owner sees these.
- A SHARED chip means someone shared it with you. PUBLISHED means it has a public link.
- The Media library tab holds your 3D models, splats and images, the same library the editor picks from. You can upload straight into a shared folder you are a member of, and new sub-folders show up at once.
03 Moving around
| Action | Control |
|---|---|
| Look around | Left-drag |
| Orbit a point | Alt + left-drag. Turns around whatever is under the cursor |
| Pan | Right-drag or middle-drag |
| Zoom | Scroll. Moves towards whatever is under the cursor, not blindly forwards |
| Fly | WASD · up E/Space · down Q · Shift for 3× speed |
| Frame the selection | F |
| Straight-on views | The view pill at the top: Top, Front, Left and the rest |
| Jump to a viewpoint | Click it in Views |
| Move / Rotate / Scale the selection | 1 2 3 |
| Undo / Redo | Ctrl+Z · Ctrl+Shift+Z or Ctrl+Y, or the arrows in the top bar |
| Find an object by name | Ctrl+F jumps to the Scene panel's search box |
Looking and flying are deliberately separate from orbiting, the same way Blender and Unity separate them, so a fly never fights an orbit mid-drag. Any movement cancels a viewpoint fly-to. Move speed and look sensitivity are in Settings → Controls, and every key is listed under Settings → Key bindings.
04 The Scene panel
The rail on the left holds Scene, Data, Agent, Simulate, Views and Assets, with Settings at the foot. Scene opens first: a tree of everything in the scene, sorted by kind. Each row carries three switches, always in the same columns:
- Eye: hide it while you work. Not saved; it is for your session.
- X-ray: make it see-through, with a soft edge glow, so you can work on what is behind it.
- Lock: stop it being moved or clicked in the 3D view. Clicks go through a locked object to whatever is behind it, in the editor and in the published viewer, and the layout agent never clears it.
Select a row to get the gizmo; 1, 2 and 3 switch it between Move, Rotate and Scale. Clicking an object in the 3D view opens its row in the tree. Double-click a name to rename. Drag a row onto a group to put it inside. New group and Collapse all are in the panel header. Groups start collapsed, and they are the main way to keep a scene legible. They matter later when you publish (§21).
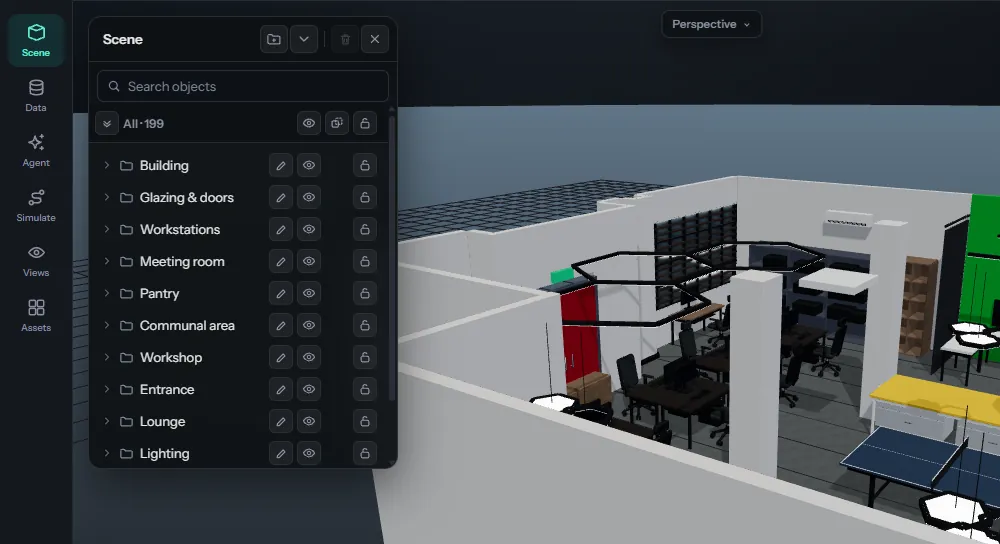
Search
Type in Search objects and the tree shows only the matches, plus the groups leading to them. Every word you type must appear in the name, in any order. Enter selects the first match, Shift+Enter selects all of them, F then frames them, and Esc clears the search.
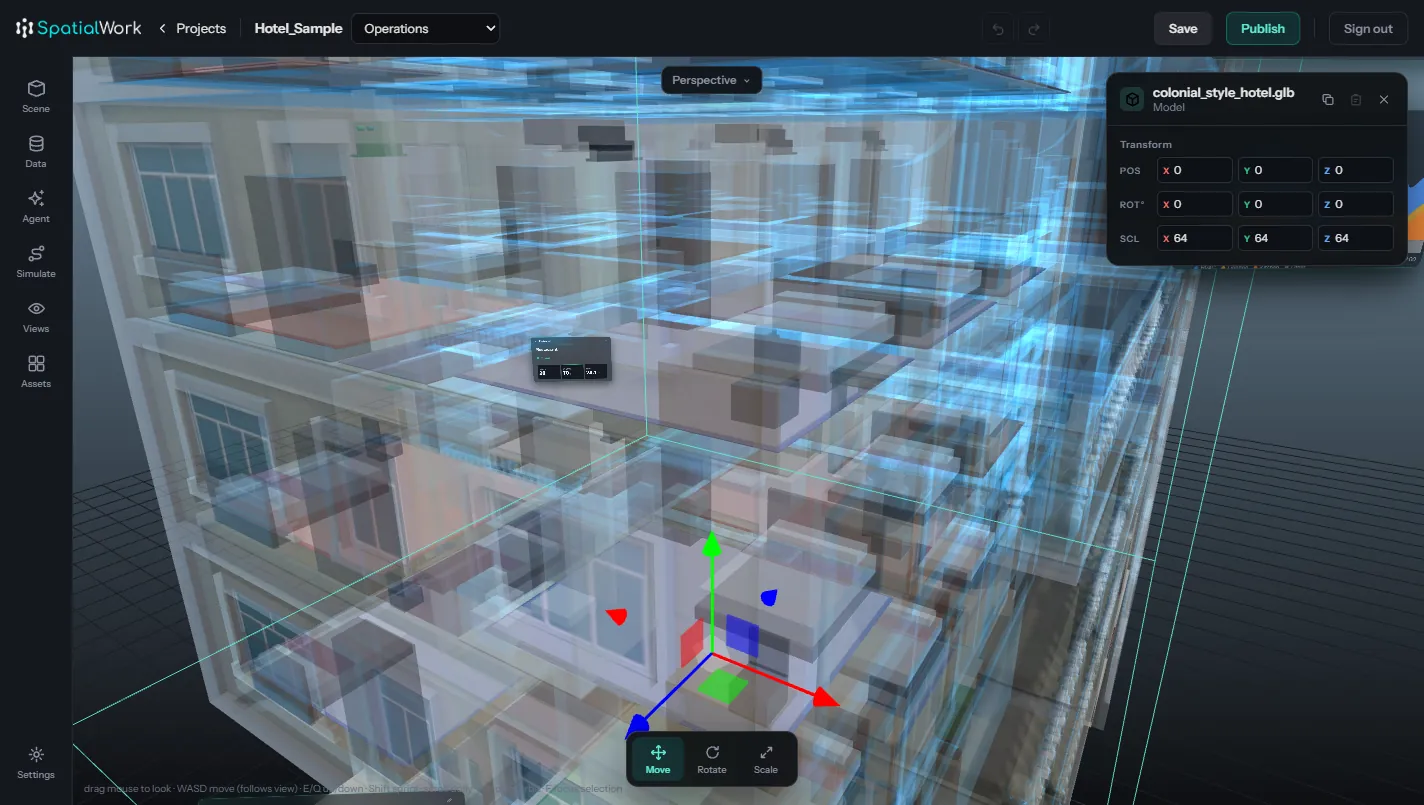
05 Undo and redo
Every edit to the scene can be undone, up to 50 steps per tab and version: moves, deletes, renames, new charts, a layout the agent applied. A whole drag counts as one step. Deleting asks you to confirm, and the confirmation reminds you that Ctrl+Z brings it back.
06 Adding 3D content
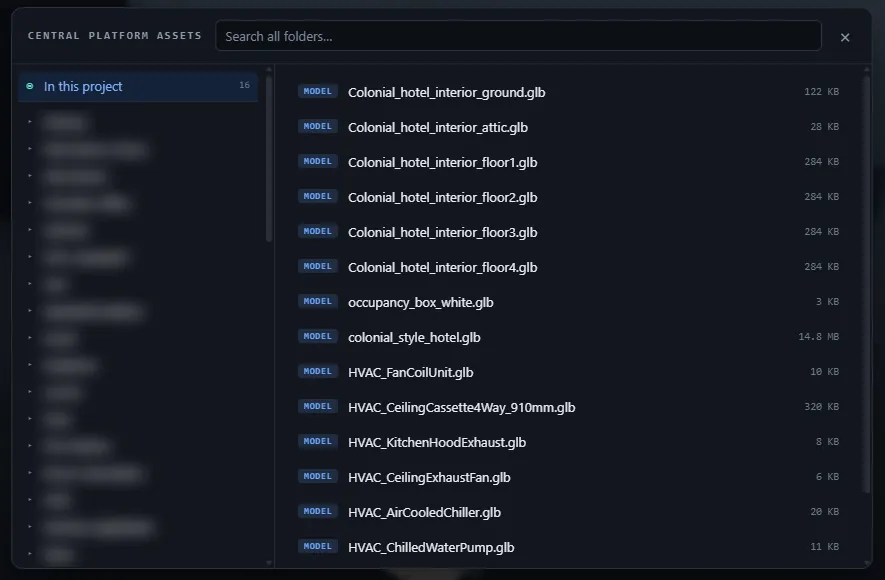
Open Assets in the rail to browse the Central Platform library: your own uploads, folders you are a member of, and the shared libraries. Pick a model or splat and it drops into the scene. Compressed GLBs (Draco or Meshopt) load as they are; there is no need to export an uncompressed copy.
The picker also shows In this project: everything the open scene already uses. That is the only listing that works on a project shared with you, since the folders belong to whoever uploaded into them.
07 Connecting data
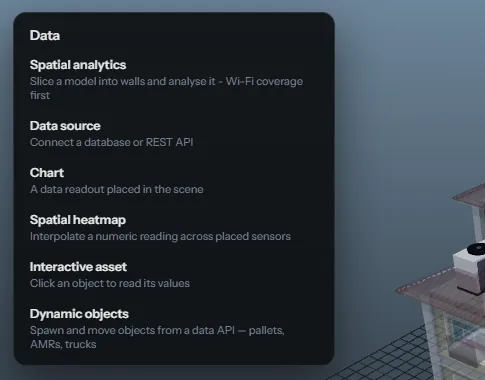
Data → Data source. A source is a connection, defined once and reused by every chart, interactive object and dynamic set in the project. Credentials are stored encrypted on the server and never sent back to the browser.
A database
Host, port, database, user, password. Queries are read-only SELECTs.
A REST / JSON API
The URL, then as much of the rest as the API needs:
| Field | Use it for |
|---|---|
| Method | GET, or POST for a read endpoint that takes its filter in the body. |
| Request body | Appears for POST. Must be valid JSON; it is checked before saving. |
| Auth | None, an API key in a header, a bearer token, a username and password, or Sign in for a token. |
| Extra headers | Name: value, one per line. For a tenant id, an API version pin, anything that is not itself a credential. |
| Read by | Our server, or each viewer's browser. Left on the first choice, it is decided when you save: a source with a login or key is always read by our server; one with none is read by viewers' browsers if this browser can reach it. |
Read by viewers' browsers
An API on a client's own network (an intranet) cannot be reached from our server, but it can be reached by the browsers of people on that network. A source read by each viewer's browser works that way: every viewer's browser asks the API itself, in the editor, the published link and an embedded dashboard alike. Every window shows the same data, and nothing passes through our server.
- Only for an API with no login or key: every viewer's browser receives the address and headers. A source with a login cannot be set to it.
- The API must allow calls from this site (CORS), and be https when the scene is.
- If you set it up from outside that network, the check on save fails and picks our server. Edit the source (✎) and set read by to each viewer's browser.
Press ⚡ on a source to test it. A failure says which half broke: bad credentials, a token that is not where expected, or the data call itself being refused.
08 Charts
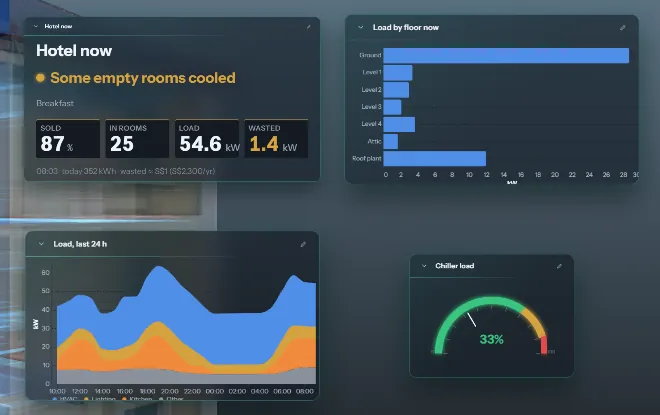
Data → Chart adds a card into the scene. Open its ✎ for the style editor.
Describe it, and let the assistant write the query
Pick the source, say what you want in plain language, for example "chiller flow rate for device 100001". Choose a type or leave it on Auto, and press Generate with AI. It fills in the query, and you press Test query to see what actually comes back before anything reaches the scene. Nothing is applied behind your back.
Types
| Type | Shows | Needs |
|---|---|---|
| Value | One big number | A query returning a single value |
| Gauge | A dial, with its threshold colours drawn on the dial's own arc | A single value, plus min and max |
| Table | Rows and columns | A query returning rows |
| Status panel | A place's state at a glance: its name in large type, a coloured headline, an explanation line, KPI tiles and a footer | A query returning one row |
| Bar, Line | A plotted series | Written by the assistant. These are the two the dropdown cannot offer, because their shape lives in a generated spec |
Status panels
A status panel is written as plain lines in the style editor, one per item:
- Status rules: condition | headline | colour. The first rule that holds sets the headline, and * catches everything else, e.g. process_queue > 0 | Queue building | #d4a340.
- Tiles: field | label | unit | colour rules. A tile can colour its own number, e.g. process_queue | Queue | | > 5 #e5484d, > 0 #d4a340.
- Explanation field and Footer: a column to show under the headline, and a line with {field} placeholders.
Styling and placement
- Format: a prefix and suffix, e.g. °C or S$.
- Thresholds: colour bands by value. A reading inside a band takes its colour.
- Icon (Value charts): Choose icon… opens the shared library. The icon sets under Spatialwork Assets Library are there for exactly this.
- Columns (Tables): comma separated, in display order; blank shows every column. The last column is the measure: format and threshold colours apply to it. This is the only way to trim a REST result, since a JSONPath returns whole records.
- Facing: turn toward the viewer, upright (the default), match the camera from any angle, or fixed in space, a panel that stays where you put it like a sign on a wall. For a fixed panel, Face my current view turns it to face you, and the gizmo turns it further. Seen from behind, its text never reads mirrored.
- Data refresh: how often, in seconds, the card asks for new data.
- Size and fold: how big the card is in metres, and whether it starts collapsed.
09 Interactive objects
Data → Interactive asset. Clicking an object in the scene opens a small panel of readings beside it. Describe what a click should show and press Ask to have the query written for you, or write it yourself.
Choose what is clickable: a whole group (everything beneath it, nested groups included), or individual objects you select and Add selected. The difference decides how the query has to look:
| Bound to | The query should return | Object id column |
|---|---|---|
| One object | Its row, or every row about it | Not needed: the binding already says which object |
| Several, or a group | One row per object | The column whose values match the object names |
Names are matched with the file extension dropped, so an object imported as pressure.glb matches a row keyed pressure. You do not need to rename anything, and your data does not need to know about .glb.
Fields to show chooses which columns the panel shows, in order. A feed that sends one row per measurement (supply temperature, return temperature, humidity for the same unit) is shown as a Measurement | Value table with units and the last update time, instead of only the last row.
Colour objects by their data
Colour objects by takes a column and a list of rules: a number range or an exact text value, each with a colour. Each object takes the colour of the first rule its own value meets, and the colours are reapplied on every refresh. An object whose row stops matching goes back to its own look. Dark models show the rule's colour too, since the tint mixes with the model's own colour instead of darkening it.
10 Dynamic objects
Data → Dynamic objects spawns and moves copies of library models from a data API: pallets in racks, AMRs on a floor, people and equipment in a hospital. Every item in the data (a person, a pallet, a wheelchair) becomes a copy of one of the models. On each refresh the copies glide to their new places, new items appear and items that are gone disappear. The panel is laid out in the order you answer it: Data, Models, Position & motion, Colour and On click.
Ask AI
The quickest way: choose the data API, describe what to show, for example "staff as people, a model per role, coloured by state with SOS pulsing red", and press Ask AI. It reads a sample of the data, the scene's place names and your library's model names, and fills in the whole panel: the list, the ID, where each item goes, a model per value, status colours, the label and the click fields. Check what it chose (the preview and the line under Refresh help) and press Apply; nothing is applied on its own. Anything it got wrong is just a field to change.
Data
Choose the data API. With a REST source every list in its data is offered with how many items it holds and their columns; choose the one that holds the things to show (the JSONPath behind it is under Edit as JSON). A database source takes a SQL query instead. The data is read straight away: a preview shows the first few items, every column question below is a list of the real columns, and the line under Refresh says how many items there are and how many would actually be placed in this scene. Nested values read as dotted columns, so pos: {x, y, z} gives pos.x, pos.y, pos.z. For a source read by viewers' browsers, keep to the lists the picker offers; filters need our server.
- ID: the column that tells items apart; one copy per distinct value. Left on auto, it takes a name- or id-like column.
- Refresh: how often to read the data, in seconds.
Models
Models come from the asset library: shared folders and your own uploads. Nothing has to be placed in the scene to be copied. Leave Model by on one model for every item and choose that model; or choose a column (such as role) and add + Model for a value for each value that needs its own (a nurse figure for nurse, a wheelchair for wheelchair); the value box offers the values in the data. + Any other value covers the rest; without it, items with an unlisted value are not shown. Each model has a size (1 is its own size) and a turn in degrees about the vertical, which every copy of it takes.
A set made by the older editor used objects in the scene as models. It opens with those turned into the same library models at the same size and turn; Apply saves it, and can delete the scene objects that were only there to be copied.
Position & motion
- Where each item goes is read from the data. Items that carry x / y / z are placed by those coordinates, in scene metres, Y up (the three columns can be changed if they are named differently). Items that name a place go there: an object in the scene, or a rack slot such as WH2-L3-R03-S07-A2-P1-L4 (face A, bay 2, pallet 1, level 4) read from that rack's slot grid; the place column is the one whose values the scene has. Only data that has both offers a link to use the other.
- Move time: how long a copy takes to glide; left on auto it lasts one refresh, so copies keep gliding from one update to the next instead of jumping and waiting. Set 0 to jump straight to the new spot.
- Face the way it moves: turns each copy towards where it is going.
Colour and On click
- Colour by: the same rules as interactive objects, per copy; a value rule offers the values in the data. A rule can also pulse, for an alarm such as an SOS.
- Label: a column shown above each copy, such as its id.
- Fields to show and Panel title: what a click on a copy shows; with no field ticked the panel shows every column.
Tracking people and equipment
Use one Dynamic object per kind of thing and put each in its own group, such as Staff, Patients and Assets: each then reads its own list and has its own models, status rules and label, and viewers can show or hide it. Kinds whose status values differ need no separate API for that reason. The data only says what is where; everything about the look stays here, so changing a colour or a model is a scene edit. Positions are x / y / z in scene metres, and the data supplies y where height matters, for example across floors; nothing is guessed. A tracking API on the client's own network is connected as a source read by each viewer's browser (§07).
Edit as JSON shows the whole set as configuration, to read, copy into another project or edit. The delete button is in the panel's header. The editor never puts the gizmo on a copy: the copies belong to the data, not to you.
In an embedded viewer
Clicking a copy sends the host page an object-click message whose instance is the item's ID (such as S-201) and whose row is its data, so the host can open its own record for that person or asset. The host page does not send positions; the viewer reads them from the data API itself.
Limitations
- Read on a timer, not pushed. Each viewer reads the API every Refresh seconds, so what it shows is up to one refresh old, and with Move time on auto a gliding copy trails the latest reading by about one more refresh. 1 to 5 seconds suits people and equipment; nothing is instant.
- The data owns the truth. An item missing from a reading is removed; nothing holds a last-known position for it. A device that goes offline should stay in the data at its last position with a state such as offline, and the colour rules show it. Height comes only from the data's y; across floors the data has to change it.
- Coordinates are scene metres. x / y / z are used as given, in the scene's own frame. Data in another origin, axis direction or unit has to be converted before it is sent (or the scene moved to match once); the viewer does not calibrate.
- A source read by viewers' browsers has to allow calls from this site (CORS), must need no login or key (one is refused on save, because every viewer would receive it), and only works for viewers who can reach it, so an intranet API shows nothing outside that network. Such a source offers its lists only; filters and queries need a source our server reads.
- A source our server reads holds a reading for up to 3 seconds, so a faster refresh shows the same positions twice; published links allow about 90 reads a minute per set for each viewer.
- Looks: a colour per status value, optionally pulsing, plus a label. There is no outline, transparency or per-item size; one model per value, with one size and turn for every copy of it.
- How many: every copy is a full model, so the count a scene can carry depends on the models' weight. Sets of about 50 copies of simple models run smoothly; for hundreds, use light models and check the frame rate.
11 Spatial heatmaps
Data → Spatial heatmap interpolates one numeric reading across a floor, between sensors that are ordinary objects in a group. Move a sensor in the editor and its contribution moves with it.
Point it at the group, give it a query returning one row per sensor, and say which column is the name and which the value. Min and max should come from the quantity (RSSI is about −90 to −30 dBm, a percentage 0 to 100), not from whatever today's sample happens to span, or later readings fall off the scale. Viridis is the default colour scheme and the safest for colour blindness; the traffic-light scheme is the one to avoid if that matters to your audience.
12 Build with Agent: data objects
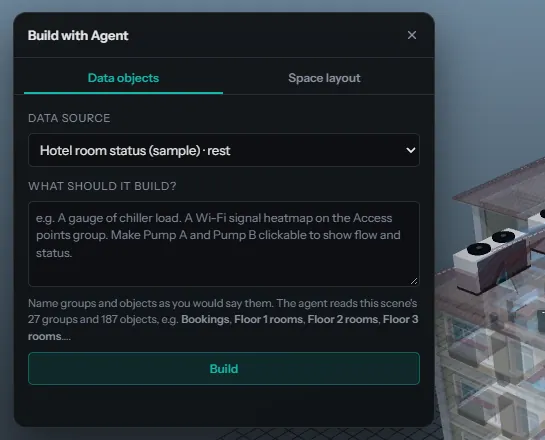
Agent in the rail opens Build with Agent, which works on the whole scene. It has two tabs: Data objects, covered here, and Space layout (§13).
Pick a data source and describe what you want, e.g. "A gauge of chiller load. A Wi-Fi signal heatmap on the Access points group. Make Pump A and Pump B clickable to show flow and status." Press Build. The agent reads the source and the scene's own names. It proposes charts (placed in front of the camera), status panels standing in each place, heatmaps on a named group, clickable objects, colour rules and dynamic sets. You see the list first and choose what goes in.
13 Space layout: plan a room with the agent
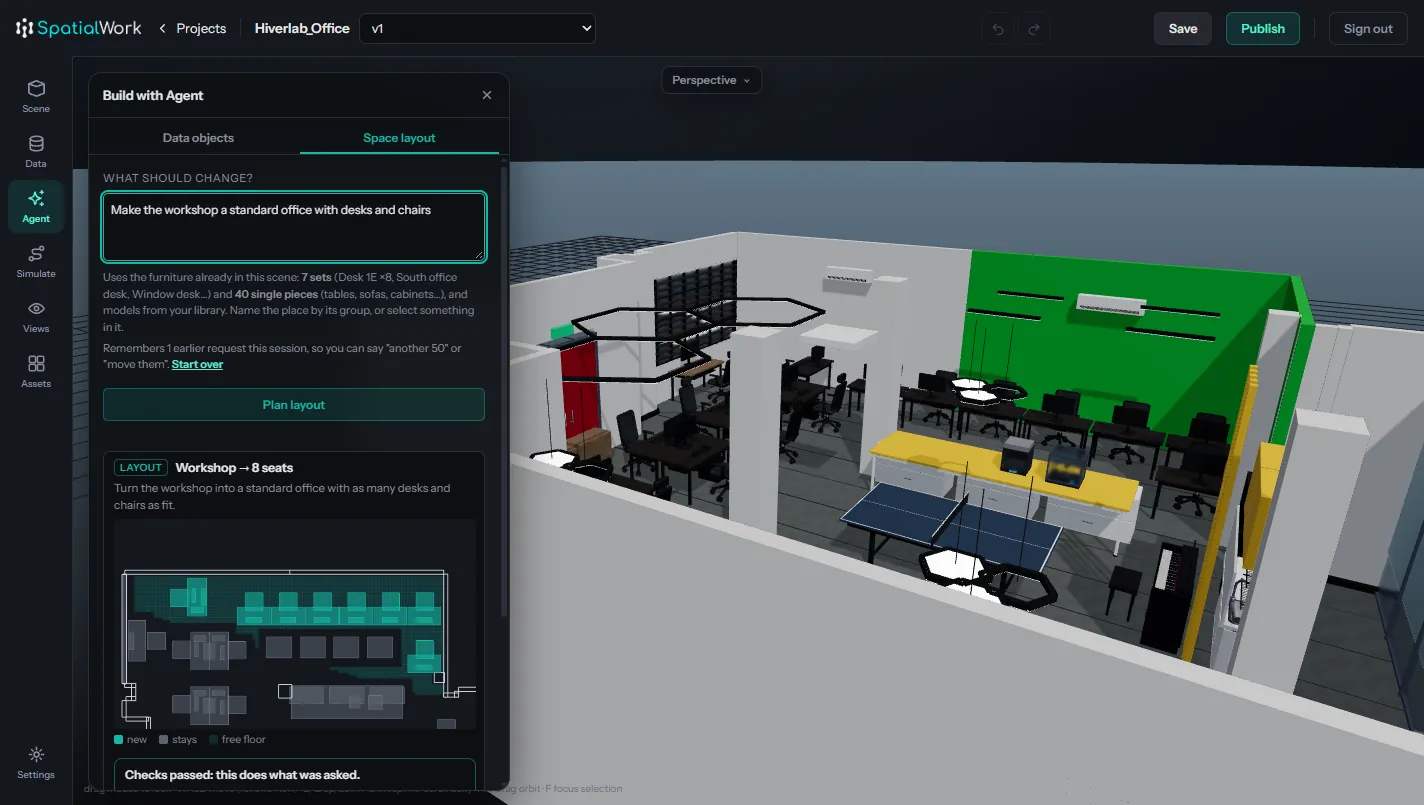
Agent → Space layout rearranges a place using the furniture the scene already has. It never generates a 3D model: every desk, chair or table it places is a copy of one already in the scene or in your library, with the same materials, so nothing new is uploaded.
What you can ask for
| Kind of request | Example |
|---|---|
| Turn a place into something else | "Make the workshop a standard office with desks and chairs" |
| A number, in rows | "200 chairs facing the stage, 10 per row" |
| Several blocks | "200 at the front, 200 at the back" |
| Fill a whole room | "Fill the space with meeting tables". Sets go in rows, single pieces along the walls |
| Put things somewhere | "Sofas in the corners", "a row of lockers along the north wall" |
| Grow what is there | "Another 50 chairs with the existing ones" |
| Edit what is there | "Remove the sofas", "rotate the desks to face the window", "move the reception desk 2 m to the left", "desks toward the window" |
| Name one object | "Chairs facing the south entrance". The agent reads every object's name, group and position, so it can aim at one exact thing |
How it works
- Say where and what. Name the place in What should change?. With no place named, it works on the place around your selection, or around the camera (shown as current). On an empty floor it starts with a 10 × 10 m square at that spot and grows it, up to 40 × 40 m, if it needs more room.
- Plan layout. The agent finds the furniture sets as they already stand: a desk with its chair, a pod of facing desks, a meeting table and its chairs. It also finds single pieces such as a sofa. They are listed under Furniture sets in this scene. Then it measures the room (walls, floor, what stays) and packs the sets in rows.
- Read the checks. The plan is checked against your request before you see it: each step's count and rows, no overlaps, inside the walls and on the floor, nothing removed that was meant to stay. Anything it could not do is listed, along with things your request named that the scene has but that are not furniture ("its name has 'vent' in it").
- Pick from the library if needed. When the scene has no model of something you asked for ("a plant", "a treadmill"), the agent searches this project's models and then the shared libraries, by all their names. You choose one with Use these, Skip it, or Search under another name. Very large models are flagged before they load.
- Preview, then decide. The result stands in the scene, with the place's old objects hidden, but nothing is saved yet. Apply here replaces the place in this version as one save and one undo step. Save as new version copies the version with the new layout and leaves this one untouched. Discard drops it.
Good to know
- The panel remembers the conversation, what each request became and whether you applied it, so a follow-up like "move them closer" or "another 200" refers back. Start over forgets it.
- Locked objects (§04) are never cleared, and filling a floor leaves alone what stands above it, such as lights and ducts.
- What a step adds goes into its own group in the Scene panel, named after the set and the count, so it is easy to hide, move or remove afterwards.
- What counts as building and what counts as furniture is judged by what a model does, not by its size. A big flat slab, or something that holds other things, is building. If the agent moves your floor, lock it.
- Library models are placed as single pieces, turned to fit. Which way an arbitrary model faces cannot be read reliably enough to build desk-and-chair sets from them, so for sets, keep one example in the scene.
14 The simulator
Simulate in the rail opens this scene's simulator in a tab of its own. It runs people through the real space: they walk the floor of your scene, queue, are served, sit, wander and leave, and you see where it gets crowded and how long people wait. Pressing Simulate again brings that tab forward without losing a run, and the simulator's Editor link goes back to the editor tab. It needs a saved project.
The page has a steps graph (what people do, in order), a floor plan with the places, a 3D view of the scene, and side tabs: Properties, People, Timing, Checks and Results. Drag the dividers to resize the panes.
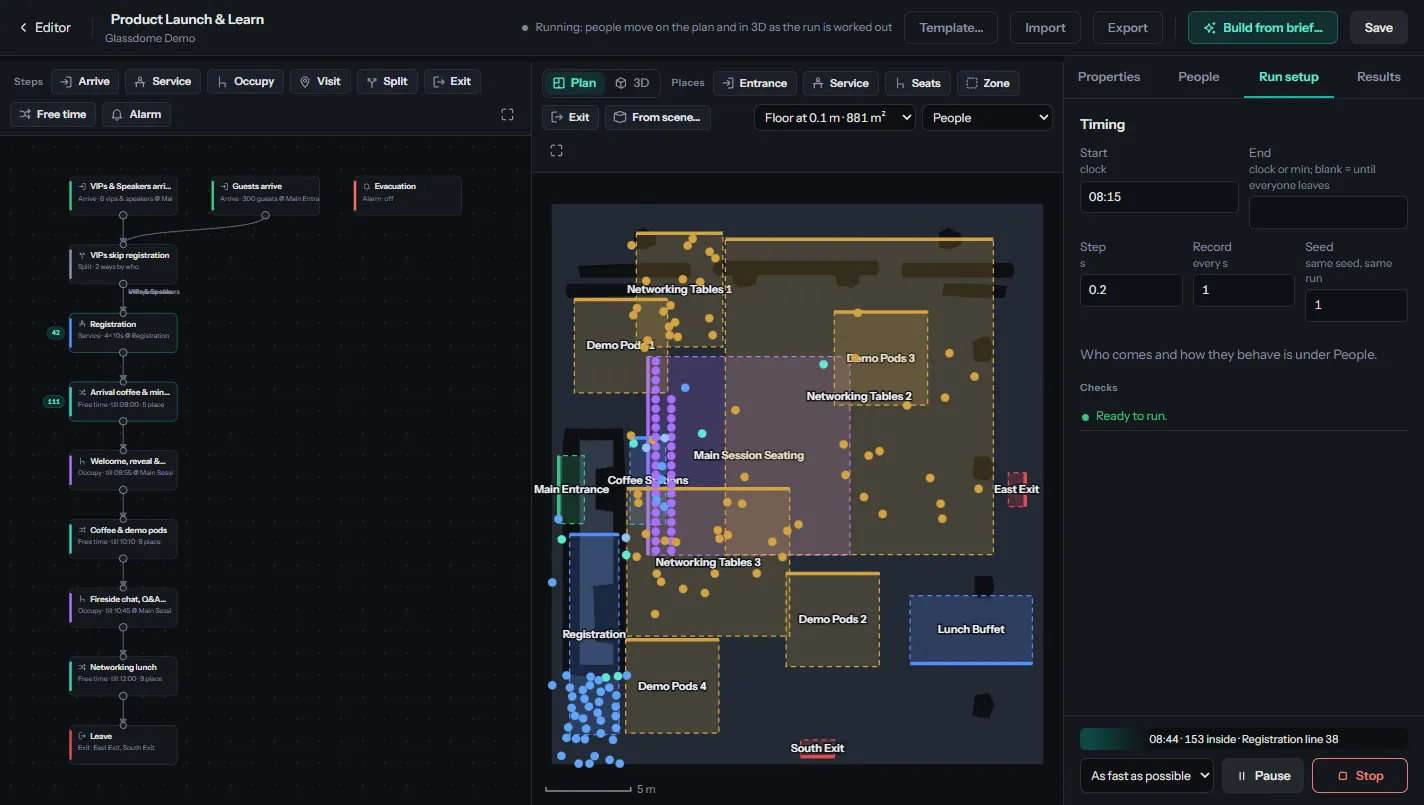
1. Start
- Start from a template: Event (arrive, register, session, coffee, leave) is ready. Warehouse is coming next.
- Build from a brief: paste or load an event brief, agenda or run sheet. The simulator measures the venue on the floor shown, picks out its landmarks (the chair block, the stage, the cocktail tables), and turns the brief into steps, kinds of people and places tied to those landmarks. A review shows what it understood, what it assumed and what it could not place before you press Create. VIPs and speakers named in a brief always become a kind of their own.
2. Steps
| Step | What people do |
|---|---|
| Arrive | Come in at an entrance: how many, between which times, evenly, randomly or at a peak |
| Service | Queue and are served: desks per place, seconds per person. Several places doing the same job share the load, and people take the quickest line |
| Occupy | Take seats or stand in an area until a clock time or for a duration; when full they stand or skip it |
| Visit | Drop by an area for a while (a share of people, a dwell time), optionally spread over several places |
| Free time | Choose where to go by what they need, until a clock time |
| Split | Branch the flow by share (70 % here, 30 % there) or by who (VIPs one way) |
| Alarm | An evacuation at a set time; everyone heads for the exits |
| Exit | Leave by one of the exit points |
3. Places
Each step happens at a place on the floor. Places from the scene makes them from the scene's objects by their names: a "Registration" desk becomes the registration place. You can also select objects in 3D and Add selected. On the plan, drag a place's arrows to Move it, its corner handles to Size it, and its ring to Turn it. Add another area copies a place so one job runs in several spots. Roof shows or hides the building above head height in 3D.
4. People and timing
- People: kinds of people (guests, VIPs, speakers, staff), each with walking speed and size, patience (gives up a line after so many minutes), the longest line they will join, how they pick a line (quickest or nearest) and an exit (quickest, nearest or the way they came in), their own reaction to the alarm, and priority at the front of lines.
- Timing: a start clock, an end time or a duration, and steps scheduled in clock times. Exits can be locked, or open only for a while; nobody is left stranded behind a locked one.
5. Run, watch and read the results
Checks lists anything the setup is missing (a service with no desks, a step with two next steps and no Split) before you run. Run plays the run while it is worked out, as fast as possible or at a speed from 1× to 240×. People move on the plan and in 3D, each step shows how many people are at it, and quiet stretches are skipped. Colour people by activity or by who they are.
Results shows queues and waits per service (and per kind of person), who gave up, how long the evacuation took and whether anyone was still inside, and crowd density. Density uses Fruin's walkway levels of service: D crowded (over 0.72 people/m²), E very crowded (over 1.08), F crush risk (over 2.17). The plan can show Peak density or Time over band D for every spot on the floor. People seated or standing in a line are not counted, since those are dense by design. Afterwards, Play replays the run.
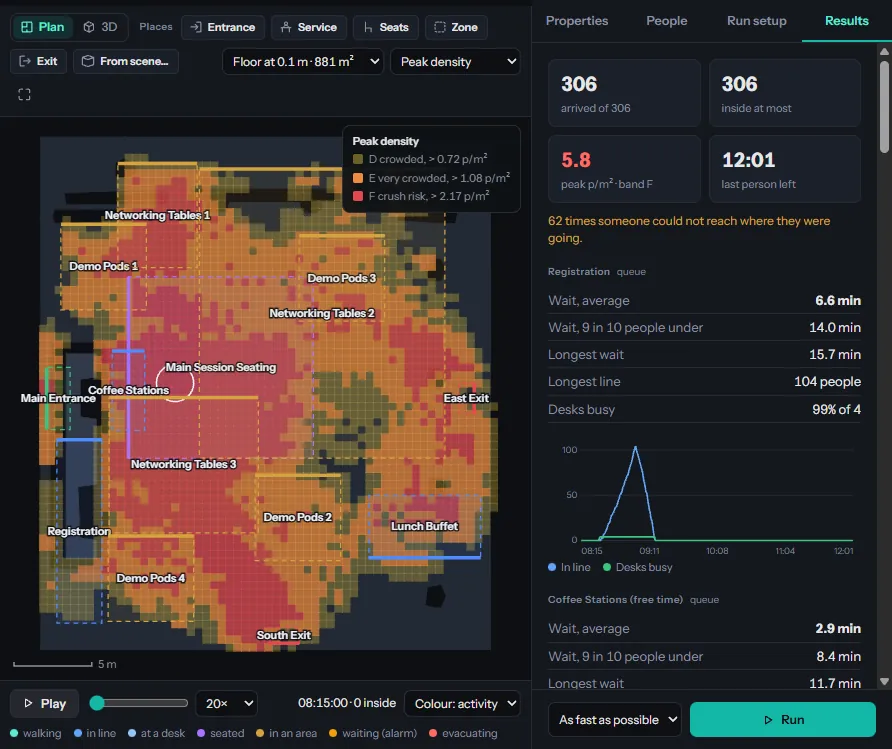
Save keeps the setup with the project (one simulation per project) and shows the revision it saved. Export downloads the setup as a file and Import loads one, to move a setup between projects.
15 Spatial analytics
Data → Spatial analytics slices a building model into walls and analyses the space. Wi-Fi coverage is the first analysis: point it at the floor model and the group of access points, slice the walls (or draw, select and fix them by hand), then press Run solver directly to compute coverage in the browser, or write an instruction and press Ask Copilot. The result is a coverage map scored only where there is building. It needs a saved project.
16 Look and settings
Settings, at the foot of the rail, has three tabs:
- Controls: move speed and look & orbit sensitivity.
- Visuals: the sun (azimuth, elevation, intensity, shadow quality), tone mapping and exposure, the background and HDRI reflections, bloom, colour grade and vignette, camera clip planes, and performance options such as ambient occlusion and the chart panels' glass blur. Reset to defaults puts it all back.
- Key bindings: every shortcut in one list.
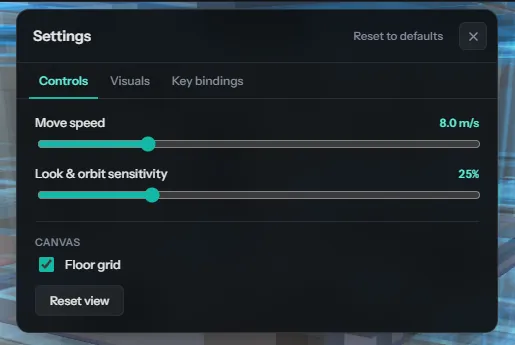
The scene's look (sun, tone mapping, exposure, bloom, background) is saved with the scene, so the published link looks the same as the editor. Shadows land on the grid, the ground you see, even under a model that hangs above it.
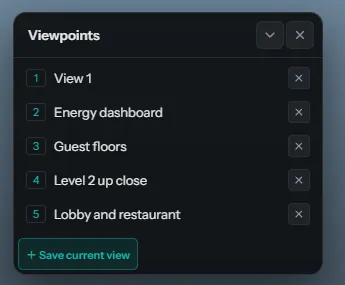
17 Viewpoints
Views in the rail saves camera positions. The first is the scene's opening view, what anyone sees when they open the project or the published link. Viewers can jump between them; they cannot change them.
18 Versions
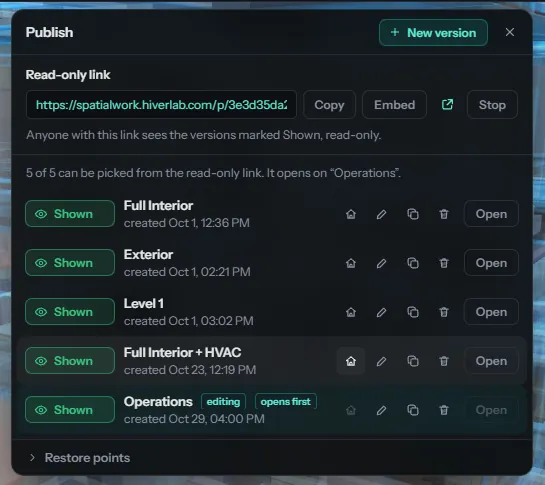
A version is an authored variant ("ground floor", "night lighting", "client cut A"), not an undo history. Each has its own objects, charts and viewpoints, and each is independently shown or hidden to viewers.
One version opens first, in the editor and on the published link. Choose it with the home button beside a version. If that version is hidden, the link opens on the first shown version instead, and the panel says so.
19 Restore points
Save a restore point in the Versions panel keeps the whole project as it is now, every version included, under a name. Roll back returns the whole project to a restore point. Nothing is lost by doing so: save the state you are leaving as a restore point of its own first, and you can come back to it. The panel says when you have edited since the last restore point.
20 Publish a read-only link
Publish gives the project one link. Anyone with it can look around, jump between viewpoints, click interactive objects, and switch between the versions you marked shown. Nothing else. They cannot edit, and they do not need an account.
21 Let viewers show and hide groups
A published scene can let whoever opens it switch whole groups off. A floor of sensors is one idea, not forty, and hiding them is easier than explaining them.
- Group the objects in the Scene panel.
- Open the group's ✎ and tick Let viewers show or hide this group.
- Publish. The viewer gets a Groups dropdown listing exactly those groups. It stays open while they switch several, and its ticks always match what is on screen.
What a viewer switches off is theirs for that visit only. It is never saved back, and it never affects anyone else opening the same link. A group inside a group gets its own switch.
22 Let someone else edit
People on a project card adds an editor by email address. They get the project on their own dashboard with a SHARED chip, and can do everything you can except publish, rename, delete or re-share it. Those stay with the owner.
23 Embedding in your own dashboard
A published scene can sit in an <iframe> and talk to the page around it: your dashboard can highlight an object when someone clicks a table row, and hear about clicks in the 3D view. Embed in the Versions panel copies a ready-made iframe snippet. A click reports the object, and the asset id and other fields its binding filters on, so the host can look it up in its own data. See the embedding guide for the full message list.
One behaviour worth knowing here: selecting an object from the host works even when the viewer has switched its group off. The host asked about an object, not a group, so the group is not revealed. Expect the readout, and the camera move, for something not currently on screen.
24 When something looks wrong
| What you see | Usually means |
|---|---|
| A chart says no data | The query returned nothing. Press Test query in the style editor to see the raw result. |
| A chart stopped updating | A short-lived token expired. Test the source; if it is a sign-in source, that renewal is automatic and the failure is elsewhere. |
| No reading matched "…" on a click | The object id column is wrong, or the query is wider than the binding. The panel names the column it used and the values it saw. |
| A heatmap is blank | No row's name matched an object in the group. It reports how many rows it had and what the objects are called. |
| Dynamic objects do not appear | Rows came back but did not land in this scene. The line under Refresh counts how many would be placed; check that the place column names objects or rack slots this scene actually has, and that every value has a model (or add Any other value). |
| The layout agent left something out | Read its Checks: it says which step it could not carry, or which named things it found that are not furniture. Nothing is saved until you Apply. |
| A table shows columns you did not want | Set Columns. A REST query cannot trim them itself. |
| Panels feel slow | Settings → Visuals → Chart panels → Glass blur. The blur behind them is the most GPU-expensive part of how they look. Ambient occlusion is the next one to turn off. |
| An icon shows a dashed box | Its URL no longer resolves; the asset was probably removed from the library. Clear it and choose another. |
| You deleted the wrong thing | Ctrl+Z. Further back than this session, roll back to a restore point. |
Updated 10 November 2026. Something here wrong or missing? It is maintained alongside the code. Tell the team and it gets corrected in the same place the behaviour lives.